Graph Transformations
Updated July 2026
Knowledge of the effect of simple transformations on the graph of with positive or negative value of as represented by , , , . Compositions of these transformations. Knowledge and use of the notation .
This topic tends to be poorly understood. Usually, when these ideas are first met, students tend to learn the rules without much understanding of what is going on. It is made more tricky by the fact that some of the ways graphs shift tend to be exactly opposite of what you might first expect; for instance, looks like it ought to shift [translate] the graph of to the right [in the positive direction] by a distance BUT THAT IS WRONG!!
We will look at each of the case in turn and explain what transformation of each represents and then we will look at a couple of examples.
The first thing to get clear is what the notation means. You are already familiar with the notation . This notation tells you that the value 'above' [i.e. the value for the point on the curve corresponding to the given value] any value is calculated using . So, as an example, for the value above must be , and similarly the value above is 19, and so on.
We can use this to understand what the notation in this section means and then use our understanding to deduce how the graphs are related to the graph of .
We will look at specific example: We will take to be and we will take
We want to compare the graphs of [] with []
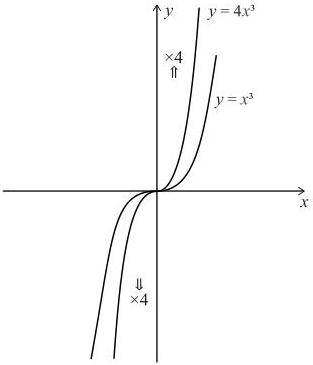
Here the transformation is reasonably straightforward to grasp: each value is four times as big for than it is for . This is like taking the graph of and stretching it vertically by a factor of 4, and the vertical stretching is away from the axis up [when the values are positive] or down [when the values are negative]
Here is a diagram of the before and after:
And here is a general diagram
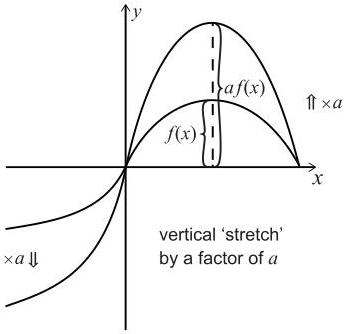
And note that if then the graphs effectively get less tall: so, if then the graphs of would be half the height of
And if is negative the heights change by and the graphs are flipped by the minus signs.
Exercise
Use a graph drawing package [e.g., DESMOS GRAPHING] to explore the following pairs of functions:
What do you notice when ?
What do you notice when ?
We will look at specific example: we will take to be and we will take
We want to compare the graphs of [] with []
If we sketch both graphs [you can do this on DESMOS GRAPHING], we can see that going from to all the values go up by 3 units. In other words, the graph is shifted up by 3 units ['up' means parallel to the -axis]. We can say this more formally by saying that we translate the graph by
In general, takes the graph of and translates it by
Exercise
Use a graph drawing package [e.g., DESMOS GRAPHING] to explore the following pairs of functions:
What do you notice when ?
An aside: note here we have written instead of as this latter expression is ambiguous – it could mean either , which is what we intend, or it could mean which is not what we intend. This sort of issue is not uncommon with trigonometry so you need to be a little careful with how you write things and how you interpret things – there are usually conventions that all mathematicians follow [for example contrasting with ]. A common example is the inverse trigonometric functions, which are often written as, for instance, . Here the is not taken to mean [as we might initially expect from our discussion of indices above] but instead the convention is that it means 'the inverse of ' which is sometimes written as . Later in your maths courses, you will probably learn things like 'the secant of ' [or ] etc, which are the specific symbols used by mathematicians for . In the TMUA/ESAT, we are very careful with the way we use notation to ensure these sorts of ambiguities do not arise; and if there is any potential ambiguity, we make sure we clarify things carefully in the way we phrase a question, or in the way we set out the mathematics.
This particular transformation is often poorly understood and can lead to errors. Errors and misunderstandings arise because it seems [perhaps intuitively at first glance?] that if you ADD something to an then things should 'shift to the right'; whereas, in fact, the opposite happens – curves shift 'to the left' [when is positive]. Of course, you could just learn what happens for this transformation, but it is [much much] better, as always, to understand things. We will unpack this transformation in following discussion: take your time working through our discussion to make sure you develop a good understanding.
There are two things to unpack here. One is how to work out an expression for given ; and the other is to work out how the transformation relates to the graphs of and .
First, let's tackle how to work out an expression for given . This is straightforward and we can look at a couple of examples to see how it works:
Example
Given find an expression for
We do this as follows: every in the expression is replaced by :
So
Example
Given find an expression for
We do this as follows: every in the expression is replaced by :
We could simplify this further, but the mathematics needed to do so is outside the scope of the TMUA/ESAT. If you sketch you might be able to work out what it could simplify to.
In this example, it is quite easy to forget that the 2 in multiples everything that we replace by: so we must have and NOT
Now you know how to work out an expression for given , we turn to look at how the graphs of each of and relate to each other.
First, we need to be very clear what the notation is telling us:
- tells us that the value directly above a given is calculated using
- tells us that the value directly above a given value is calculated using
Let's check this is clear using an example.
Example
Let's look at:
If we were to sketch we can calculate the values for some values:
- When ,
- When ,
So if we sketch we would find that when is 2 the value directly above it would be 4, and when is 5 the value directly above it would be 32.
Now let's look at what happens if we were to sketch :
- When , the value directly above it must which is and we worked that out to be
- When , the value directly above it must which is and we can work that out to be
So [and think about this carefully] the value above a given value in comes from the above the value that is three units further along on the sketch of :
- The value above is actually
- The value above is actually
We have to translate the graph of to the left to make sure that the value above in the graph of is the one from and that the value above is the one from .
We can draw a sketch of this to show what is happening:
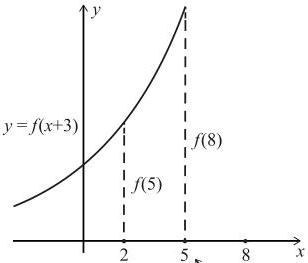
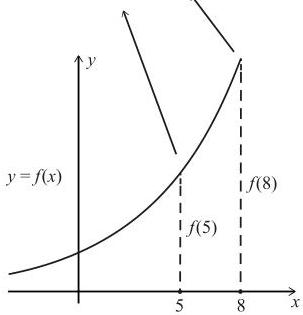
So, we can now look at this in general terms. If you look at the graph of then the value above an value is actually and this is the value that is above on the original graph.
This means that the graph of is the same as the graph of when it is translated backwards parallel to the axis a distance of . We can say:
And note that if is negative [e.g., ] then the graph shifts “to the right” by 4, that is a translation of
It is worth thinking carefully about this transformation – it can seem a little complicated with lots of and and values flying about. But once you have grasped what is going on, it can all seem very easy and “obvious”.
We strongly recommend you do the following exercise to get used to this transformation.
Exercise
Sketch the following in pairs of functions without using a graphing package, and then check your answers using a graphing package [such as DESMOS GRAPHING]. Think about how each pair of graphs relates to what we discussed above when unpacking the transformation from to
This transformation is very similar to the one we have just looked at. It is initially counter-intuitive but the reason it “squashes” a graph by a factor of is “obvious” once you have thought it through with some examples.
We will first look at some examples that illustrate how to find the expression for given an expression for ; and then we will look at how the graphs of and relate.
Example
Given find an expression for
To find we replace by :
And note that we do NOT write
Example
Given find an expression for
As before, we replace every in by to get
Now, let’s turn to look at how the graphs of and are related. We will do this using simple examples. You will note that the discussion is similar to that we set out for above.
Example
Let's look at:
If we were to sketch we can calculate the values for some values:
- When ,
- When ,
- When ,
- When ,
So, if we sketch we would find that when is the value directly above it would be , when is the value directly above it would be , ...and so on
Now let's look at what happens if we were to sketch :
- When , the value directly above it must which is and this is
- When , the value directly above it must which is and this is
- When , the value directly above it must which is and this is
- When , the value directly above it must which is and this is
So [and think about this carefully] the value above a given value in comes from the above the value that is twice as large on the -axis on the sketch of
We have to 'squash' the graph of towards the -axis by a factor of .
We can draw some diagrams to show what is happening here:
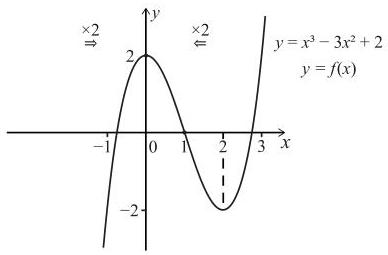
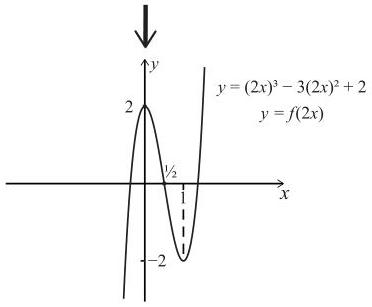
Exercise
Using a graphing package [such as DESMOS GRAPHING], draw the following pairs of functions:
From the example above: and
Then look at and
What does this tell you about when ?
Now look at and ; in this, what does the minus sign do in and what does the 2 do in ? Can you explain your answers?
Let's summarise the transformations we have looked at.
| Vertical [parallel to -axis] stretch away from -axis by a factor of . If [i.e., negative] there is a reflection in the -axis too. | |
|---|---|
| Translation by | |
| Translation by | |
| Horizontal [parallel to -axis] squash towards -axis by a factor of . If [i.e., negative] there is a reflection in the -axis too. |
Exercise
Sketch and for and for
You can use DESMOS GRAPHING to help you, but try to sketch the graphs without using any graphing packages
Combining these transformations
In this section we will look at some examples where more than one of the transformations listed above is used.
It is important to be very careful when using certain combinations of the transformations above because the order in which you interpret the transformation must be correct.
We will look at this using a test case:
Consider and
If you were asked to sketch and use your sketch to deduce a sketch of , it would be tempting to suggest it is
- a "horizontal squash" by a factor of 2 followed by a translation by ;
- or perhaps it is tempting to suggest that it is a translation by followed by a "horizontal squash" by a factor of 2.
Before reading on, which of the two suggested transformations is the one you would choose? Or would you propose something else instead? You can use a graph sketching package to explore before we look at the answer.
To answer this, we can look at the transformations suggested in stages:
- "horizontal squash" by a factor of 2 followed by a translation by :
- translation by followed by a "horizontal squash" by a factor of 2
We can see here that 2 gives the correct final answer and 1 gives the incorrect answer. Can you explain why? (If we replace by first, then the translation by is also affected by the 2 in the .)
We can write the function slightly differently to get another perspective on the transformation:
- “horizontal squash” by a factor of 2 followed by a translation by :
Exercise
Consider the graph of
Sketch both and
What do you notice? Explain your answer.
Now consider
Sketch both and
What do you notice? Explain your answer.
The notation .
We will look briefly at the notation [which we tend to say as “ of of ”]
We have been using the ideas connected to this notation already.
Let’s take a simple case to illustrate how to unpack his notation:
Let’s take and
The in is just a label to tell you what to do with what you input into the function. That is once you are given an input for , the output is given as
So, you can guess what might mean: it means that you take as the input for . We can write this out:
- Replace [which labels the input to ] in by :
- And then replace by
But it is easier to put in immediately and skip step 1.
Exercise
Given
Find simplified expression for
What do you notice?
Is it true that ?