Trigonometric Functions Graphs Symmetries
Updated July 2026
The sine, cosine, and tangent functions
The sine, cosine, and tangent functions; their graphs, symmetries, and periodicity.
You should make sure you know the standard graphs of sine, cosine, and tangent very well – and, as mentioned, all their symmetries and periodicities. Make sure you can sketch them for degrees and for radians. We would recommend you use a good graph sketching package [e.g., DESMOS GRAPHING] and explore each of the graphs and also when they cross each other, what happens if you modify the graphs [see more later under graph sketching].
Exercise
[use a graph sketching tool to check your answers]
Sketch each of the following using a graph sketching package; sketch each in degrees and then radians using the ranges and [this is not a typo: these are not the same ranges!]
Sketch on the same axes and for . For what values of in the range does ? And for what values does
Sketch each of the following for and pay careful attention to what the number 2 does and what the does to each graph.
Sine and cosine as projection operators
A useful way to think of sine and cosine is as "projection operators". They project lines onto the x-axis or the y-axis.
In these diagrams the line coming out at an angle always has positive length. The cosine function projects the line onto the x axis; and the sine function projects the line onto the y axis.
Here are some diagrams to illustrate what we mean:
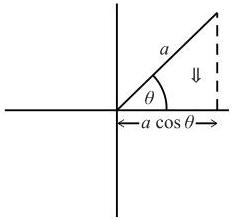
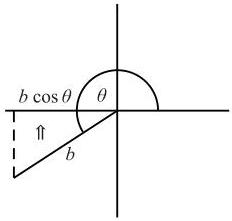
Above, in the second diagram, b cos θ is negative.
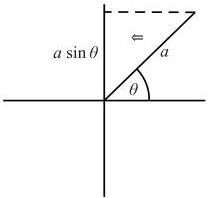
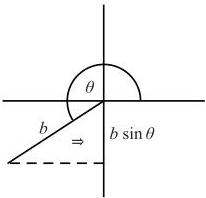
Above, in the second diagram, b sin θ is negative.
You can see that the diagrams are essentially the "CAST" diagrams you might have drawn when solving trigonometric equations. They also help you understand why cosine and sine vary in sign for different angles.
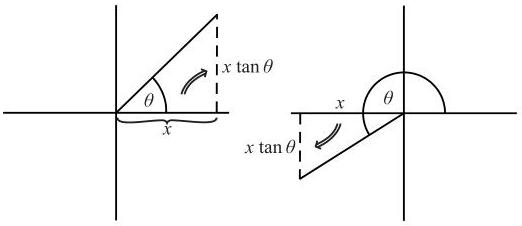
Tangent also has an interpretation – it converts from -axis projections to -axis projections. Here are a couple of diagrams to illustrate what we mean:
Exercise
What is the sign of in each of the diagrams above? Can you explain your answer? [Hint: think carefully about the sign of the value in each diagram and the sign of the value in each diagram]. How does your answer fit with the sign of when ? And what about ?