Recognising and Sketching Graphs of Common Functions
Updated August 2025
Mastering the characteristic shapes of common functions is essential for the TMUA. You must be able to recognise and sketch lines, quadratics, cubics, trigonometric, exponential, and logarithmic functions. This guide covers their properties, including domain, range, and the behaviour of the modulus function.
A function's graph is a visual representation of all coordinate pairs that satisfy the rule . Recognising the general form of these curves allows for rapid problem solving and the identification of roots and stationary points.
Polynomial Graphs
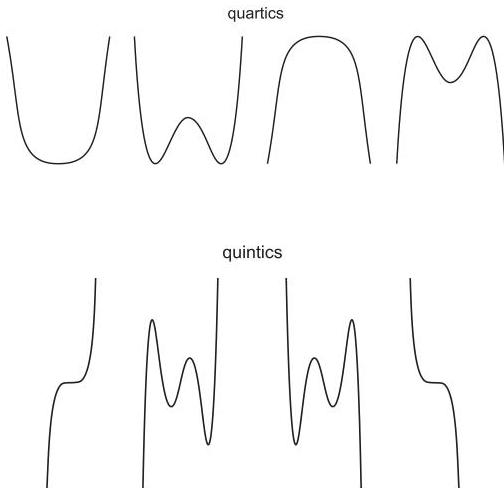
You are expected to understand the general shapes of polynomial functions, specifically quadratics, cubics, quartics, and quintics. The behavior of these graphs is largely determined by the degree of the polynomial and the sign of the coefficient of the highest power of .
For a quadratic , the graph is a parabola. It is shaped if and shaped if . Cubics, quartics, and quintics exhibit more complex behavior but follow predictable patterns regarding their end behavior and the maximum number of stationary points they can possess. A polynomial of degree has at most stationary points.
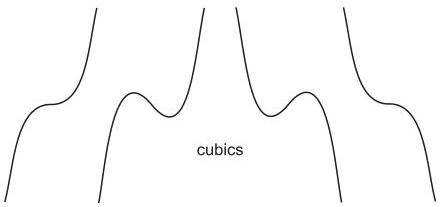
As shown in the diagrams, when the highest power of has a positive coefficient, the graph eventually increases towards positive infinity as increases. Conversely, a negative leading coefficient results in the graph decreasing towards negative infinity.
Exponential and Logarithmic Graphs
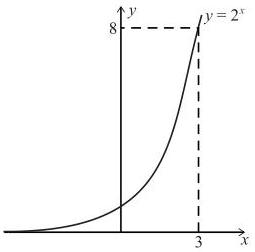
The exponential function (for ) is always positive and passes through . Its shape depends on whether (growth) or (decay). As becomes very large and negative (for ), the graph approaches the axis but never touches it, which is known as a horizontal asymptote.
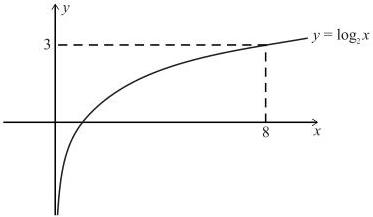
The logarithmic function is the inverse of the exponential function. It is only defined for and passes through the point . It has a vertical asymptote at the axis ().
Trigonometric and Square Root Graphs
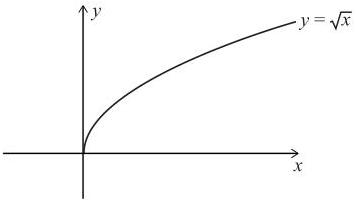
Trigonometric functions like , , and are periodic. You must be familiar with their symmetries and their behavior in both degrees and radians. The square root function always refers to the positive square root in the TMUA. Its domain is restricted to , and it is a one to one function.
The Modulus Function
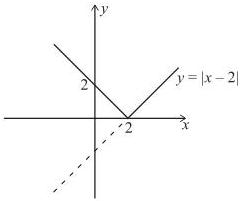
The modulus function essentially makes all values positive. It can be interpreted as the positive distance of a value from zero. To sketch , you should first sketch the graph of . Any part of the curve that sits below the axis is reflected in the axis to become positive. The parts already above the axis remain unchanged.
Consider the example and its modulus version :
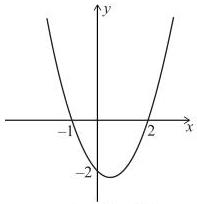
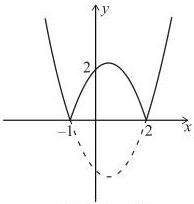
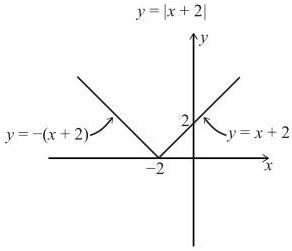
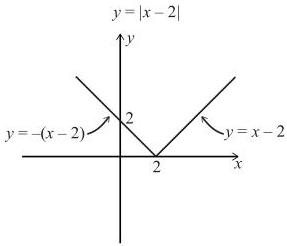
For a linear function , the modulus creates a characteristic shape with a corner at the root . This corner is where the gradient is not uniquely defined.
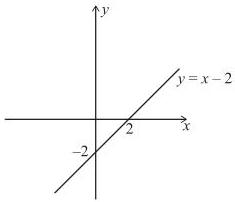
When solving equations or inequalities involving the modulus, it is helpful to identify the equation of the reflected section. For , the reflected bits have the equation , while the original bits retain .
Key takeaways
- A polynomial of degree has a maximum of real roots and stationary points.
- The exponential function is always positive, while the log function is only defined for positive .
- To sketch , reflect any portion of the graph below the axis upwards.
- The square root symbol in the TMUA specifically denotes the positive root.
- Trigonometric graphs like and have a range of to .
When sketching, always mark the and intercepts and the coordinates of any stationary points. For TMUA questions, a quick sketch can often reveal the number of solutions to an equation faster than algebraic manipulation.
Be careful when sketching compared to . The latter reflects the output, while effectively reflects the right hand side of the graph onto the left hand side, making the function even.
The relationship between the degree of a polynomial and its number of roots is fundamental. A cubic must have at least one real root because its ends go to opposite infinities, whereas a quadratic or quartic might have no real roots if the entire curve sits above or below the axis.
Worked Examples
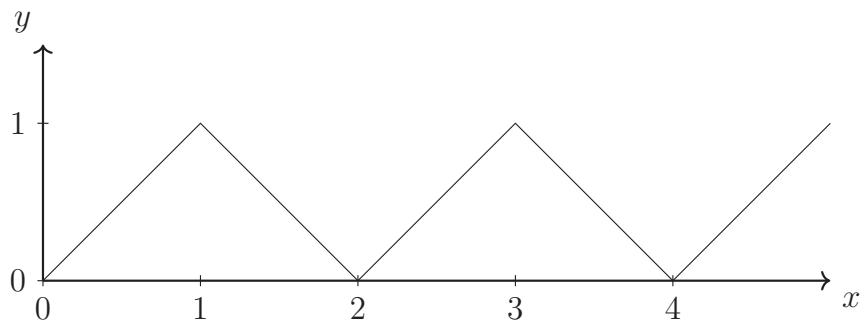
The graph consists of alternating straight-line segments of gradient and and continues in this way for all values of .
The function is defined as
Find the value of
Practice Questions
Frequently asked questions
What is a point of inflexion in a polynomial graph?
A point of inflexion is where the curve changes its concavity. In simple polynomials like , it occurs at the origin where the graph flattens out and changes from 'curving down' to 'curving up'.
Why is the domain of restricted to ?
Since is the inverse of , and is always positive for any real , there is no power to which we can raise a positive base to result in a negative number.
How do I find the intercept of any given function?
The intercept always occurs where . Substitute into the equation to find the corresponding value.
Does have a derivative at ?
No. At , the graph of has a sharp corner. The gradient to the left is and the gradient to the right is , so there is no unique tangent or derivative at that specific point.